04
Non-Financial Indicators Handbook -
2013
-
VIVENDI
1
Economic Indicators
2012
2013
2013
2012
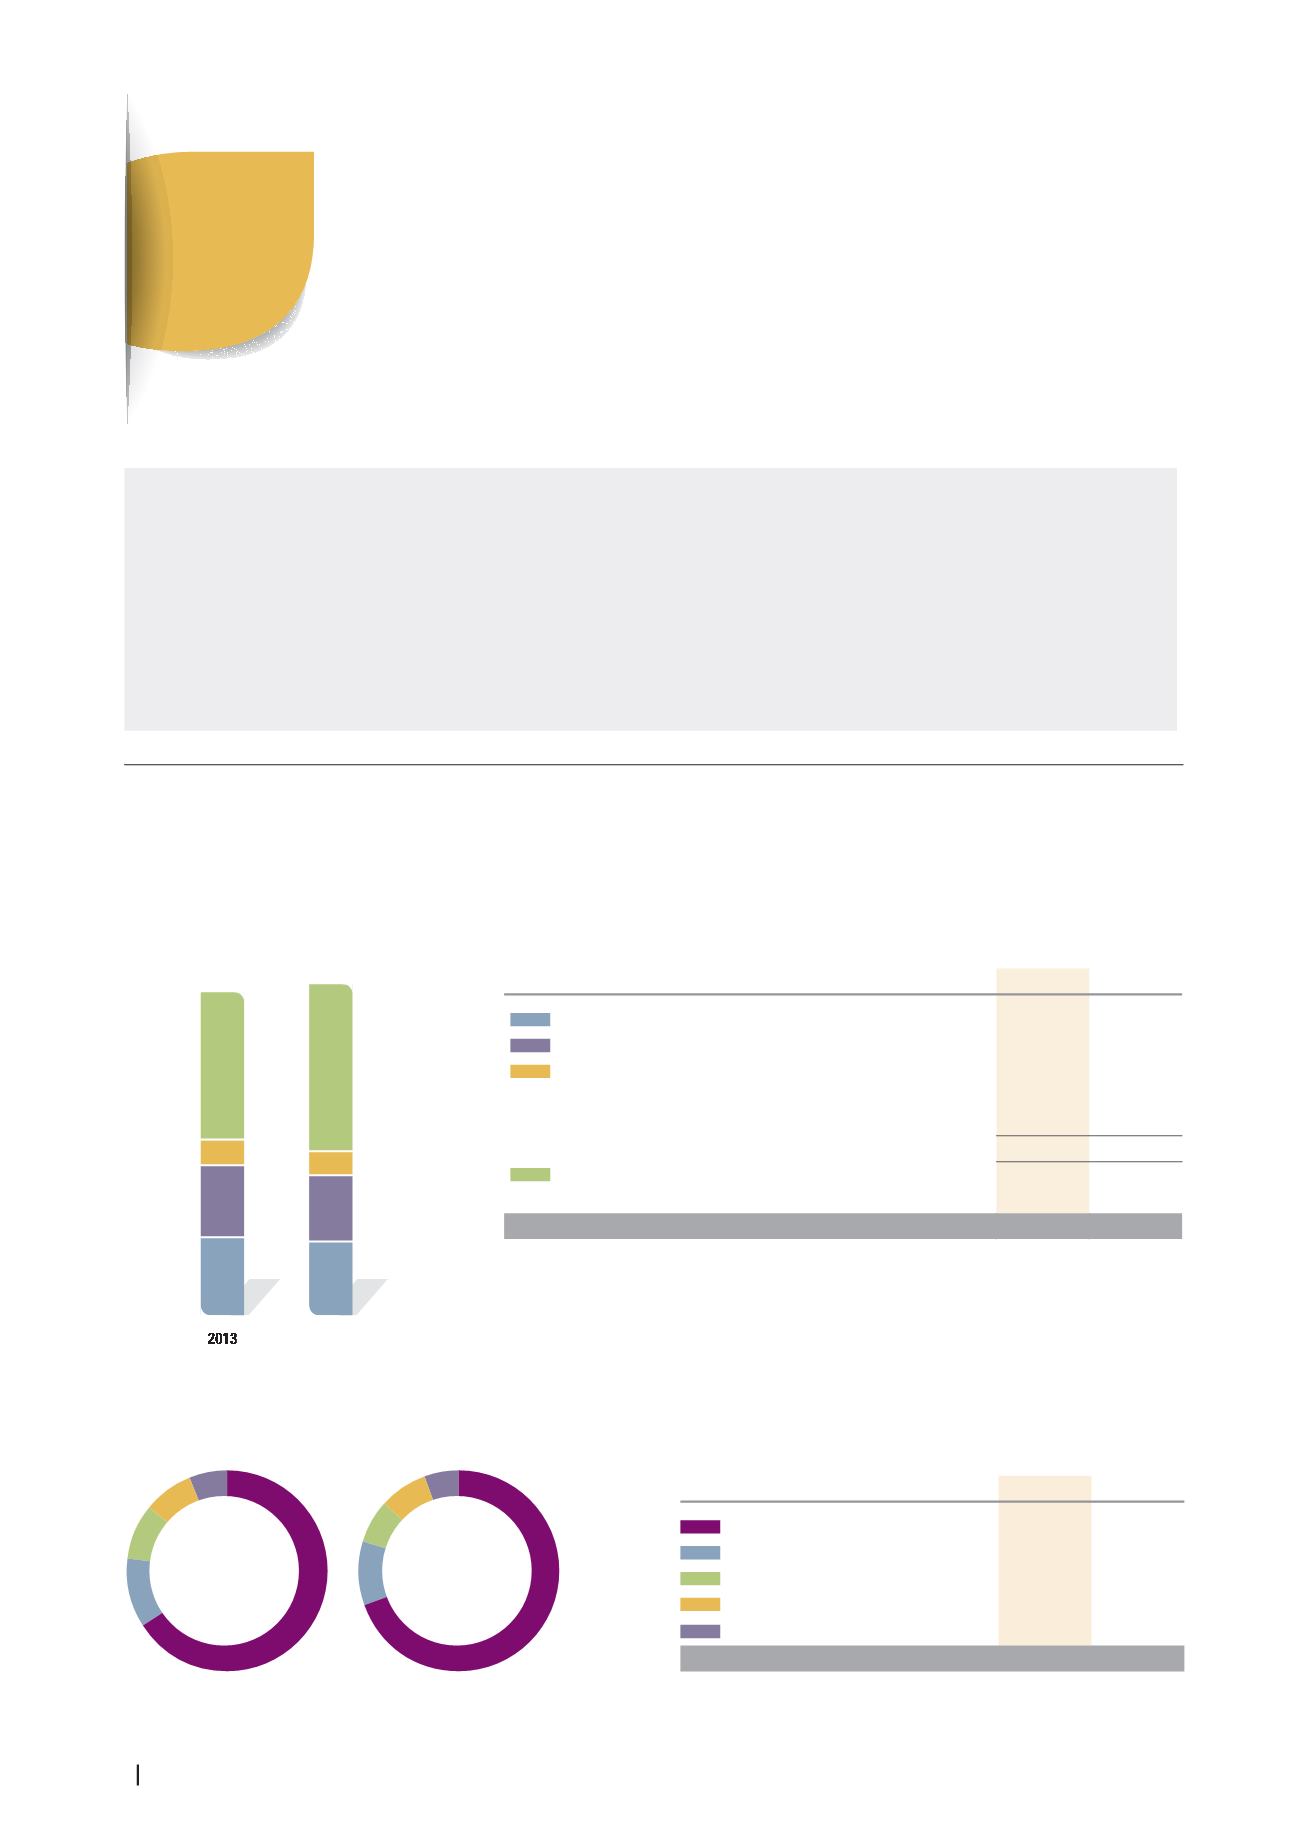
France
14,662
15,664
Rest of Europe
2,465
2,204
USA
1,883
1,594
Brazil
1,776
1,776
Rest of the world
1,349
1,339
TOTAL
22,135
22,577
2013
2012
Canal+ Group
(a)
5,311
5,013
Universal Music Group
(b)
4,886
4,544
GVT
1,709
1,716
Other
72
66
Elimination of intersegment transactions
(17)
(26)
Media & Content
11,961
11,313
SFR
10,199
11,288
Elimination of intersegment transactions related to SFR
(25)
(24)
TOTAL
22,135
22,577
(a)
Includes D8 and D17, consolidated since September 27, 2012, and “n”, consolidated since November 30, 2012.
(b)
Includes EMI Recorded Music, consolidated since September 28, 2012.
Revenues by geographic area
(December 31 - in millions of euros)
0
5,000
10,000
15,000
20,000
25,000
2012
Revenues by business segment
(December 31 - in millions of euros)
1.1
Breakdown of Revenues
The economic indicators presented hereafter are extracted from the
Consolidated Financial Statements for the year-end December 31,
2013, prepared in accordance with International Financial Reporting
Standards (IFRS). Therefore, as from the second quarter of 2013, in
compliance with IFRS 5, Activision Blizzard and Maroc Telecom Group
have been reported in Vivendi’s Consolidated Statement of Earnings as
discontinued operations. In practice, income and charges from these
two businesses have been reported as follows:
their contribution until the effective divestiture, if any, to each
line of Vivendi’s Consolidated Statement of Earnings (before
non-controlling interests) has been grouped under the line
“Earnings from discontinued operations”;
in accordance with IFRS 5, these adjustments have been applied
to all periods presented to ensure consistency of information; and
their share of net income has been excluded from Vivendi’s
adjusted net income.


