


 4 / 71

Economic
Indicators
The economic indicators presented hereafter are extracted from Vivendi’s
Consolidated Financial Statements for the year-end December 31, 2015,
prepared in accordance with International Financial Reporting
Standards (IFRS).
SFR and Maroc Telecom group were sold in 2014; GVT was sold on
May 28, 2015. In compliance with IFRS 5, their contribution, until their
effective divestiture, is excluded from the figures presented below (see
Vivendi’s Annual Report 2015, p. 8).
❙
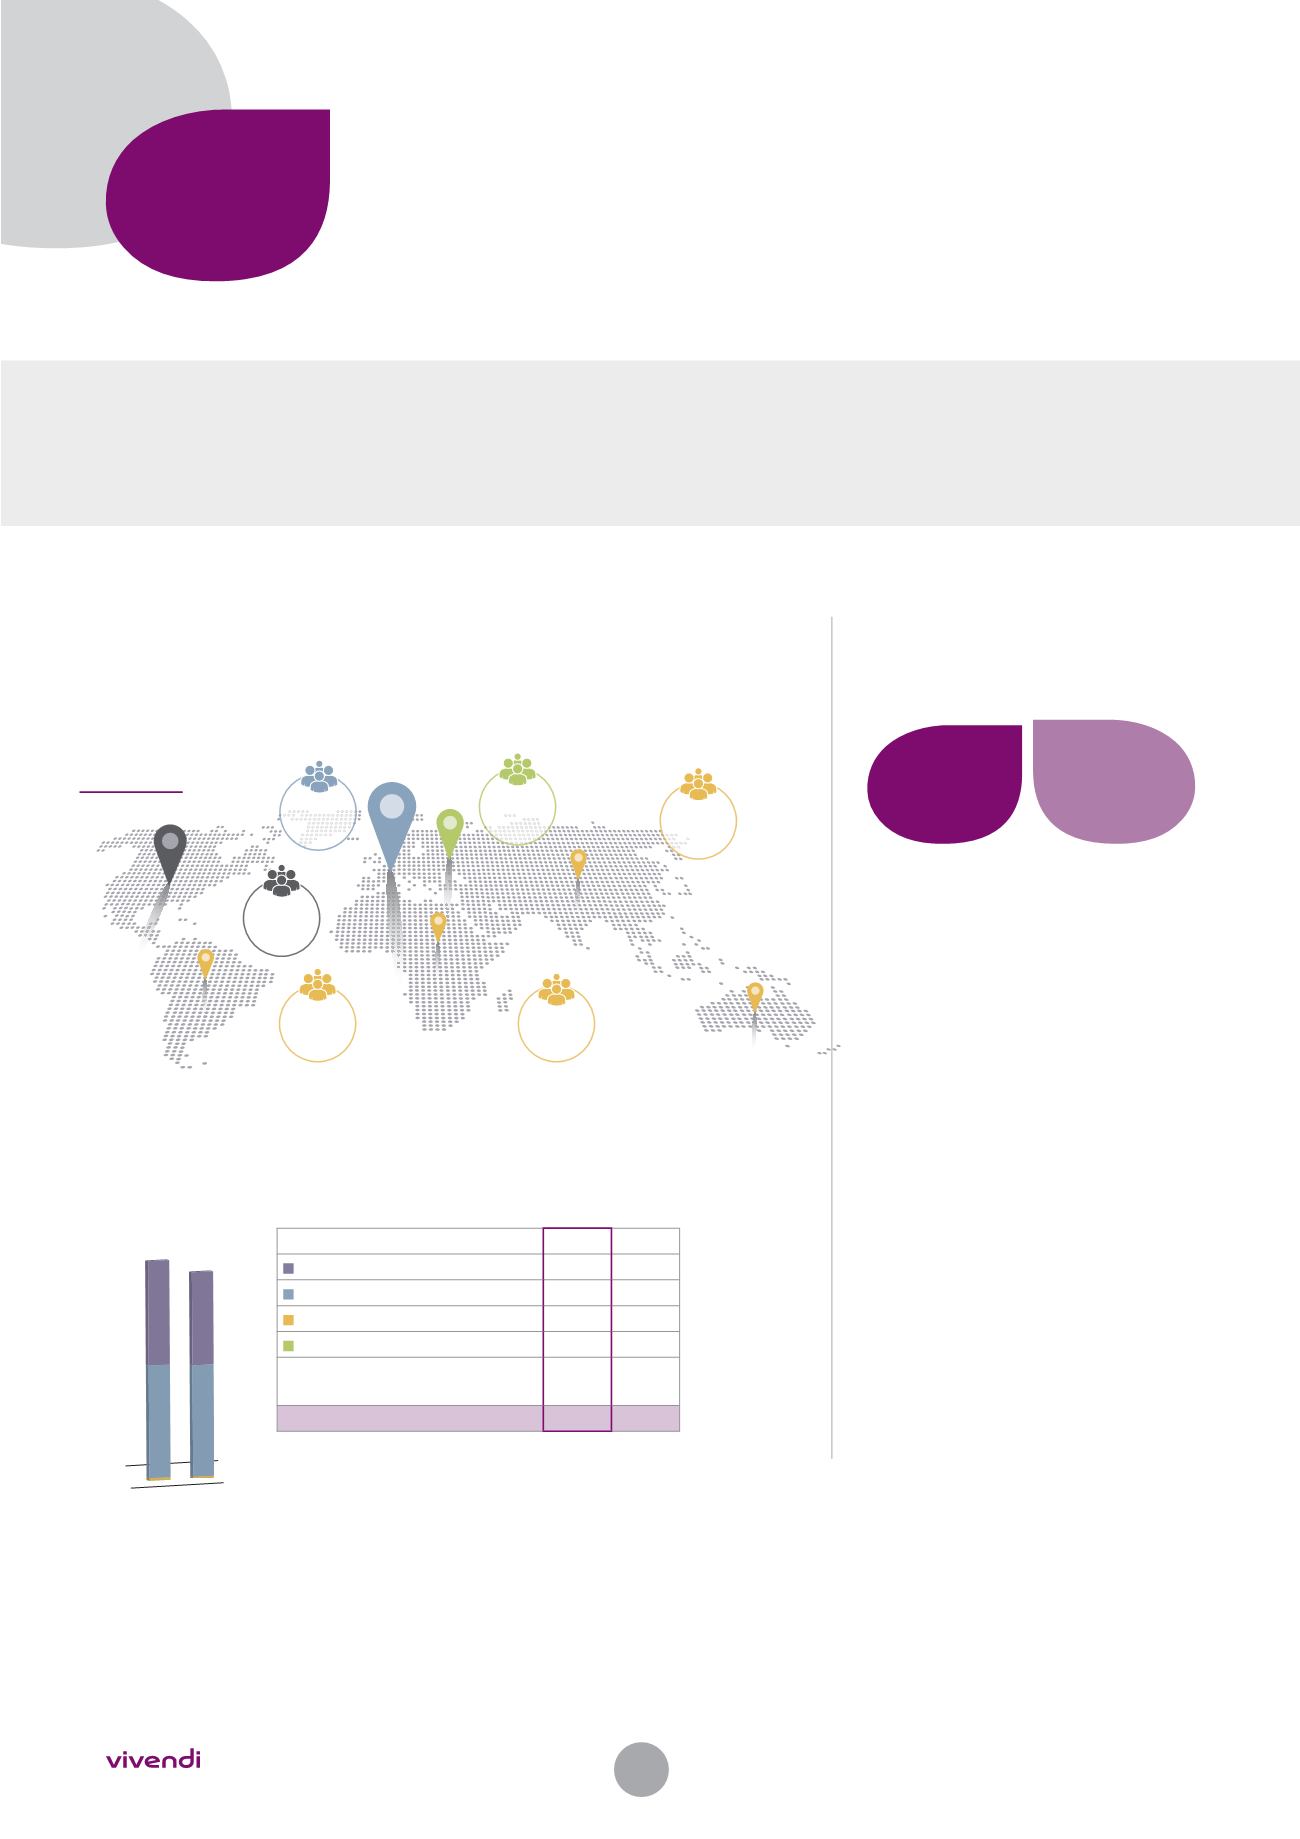
REVENUES AND HEADCOUNT BY GEOGRAPHIC REGION
December 31 – in millions of euros
❙
REVENUES BY BUSINESS SEGMENT
December 31 – in millions of euros
1
10,762 10,089
2015
2014
2015
2014
Universal Music Group
5,108
4,557
Canal+ Group
5,513
5,456
Vivendi Village
100
96
New Initiatives
43
0
Elimination of intersegment
transactions
(2)
(20)
TOTAL
10,762 10,089
❙
GROSS INVESTMENTS IN CONTENT
December 31 – in millions of euros
Gross investments in content represent
the films, television and sports rights paid
by Canal+ Group, the advances paid by
Universal Music Group to artists, as well
as the investments in content realized by
Vivendi Village’s entity Watchever and by
Dailymotion and Vivendi Content.
FRANCE
4,464 M€
REST OF EUROPE
2,567 M€
REST OF THE WORLD
1,540 M€
USA
2,191 M€
TOTAL
REVENUES
2015
10,762 M€
France
5,694
Europe
(excl. France)
5,016
South and
Central America
339
Africa
1,143
Asia-Pacific
1,420
North
America
2,783
2,309 2,333
2015
2014
Some additional indicators are presented in Chapter 2 of this Handbook, under the section 2.10 “The Value Creation Circuit”.
EXTRA-FINANCIAL INDICATORS HANDBOOK
2015
4