


 173 / 348

4
Section 4 - Business segment performance analysis
Financial Report
| Statutory Auditors’ Report on the Consolidated Financial Statements | Consolidated
Financial Statements | Statutory Auditors’ Report on the Financial Statements | Statutory Financial Statements
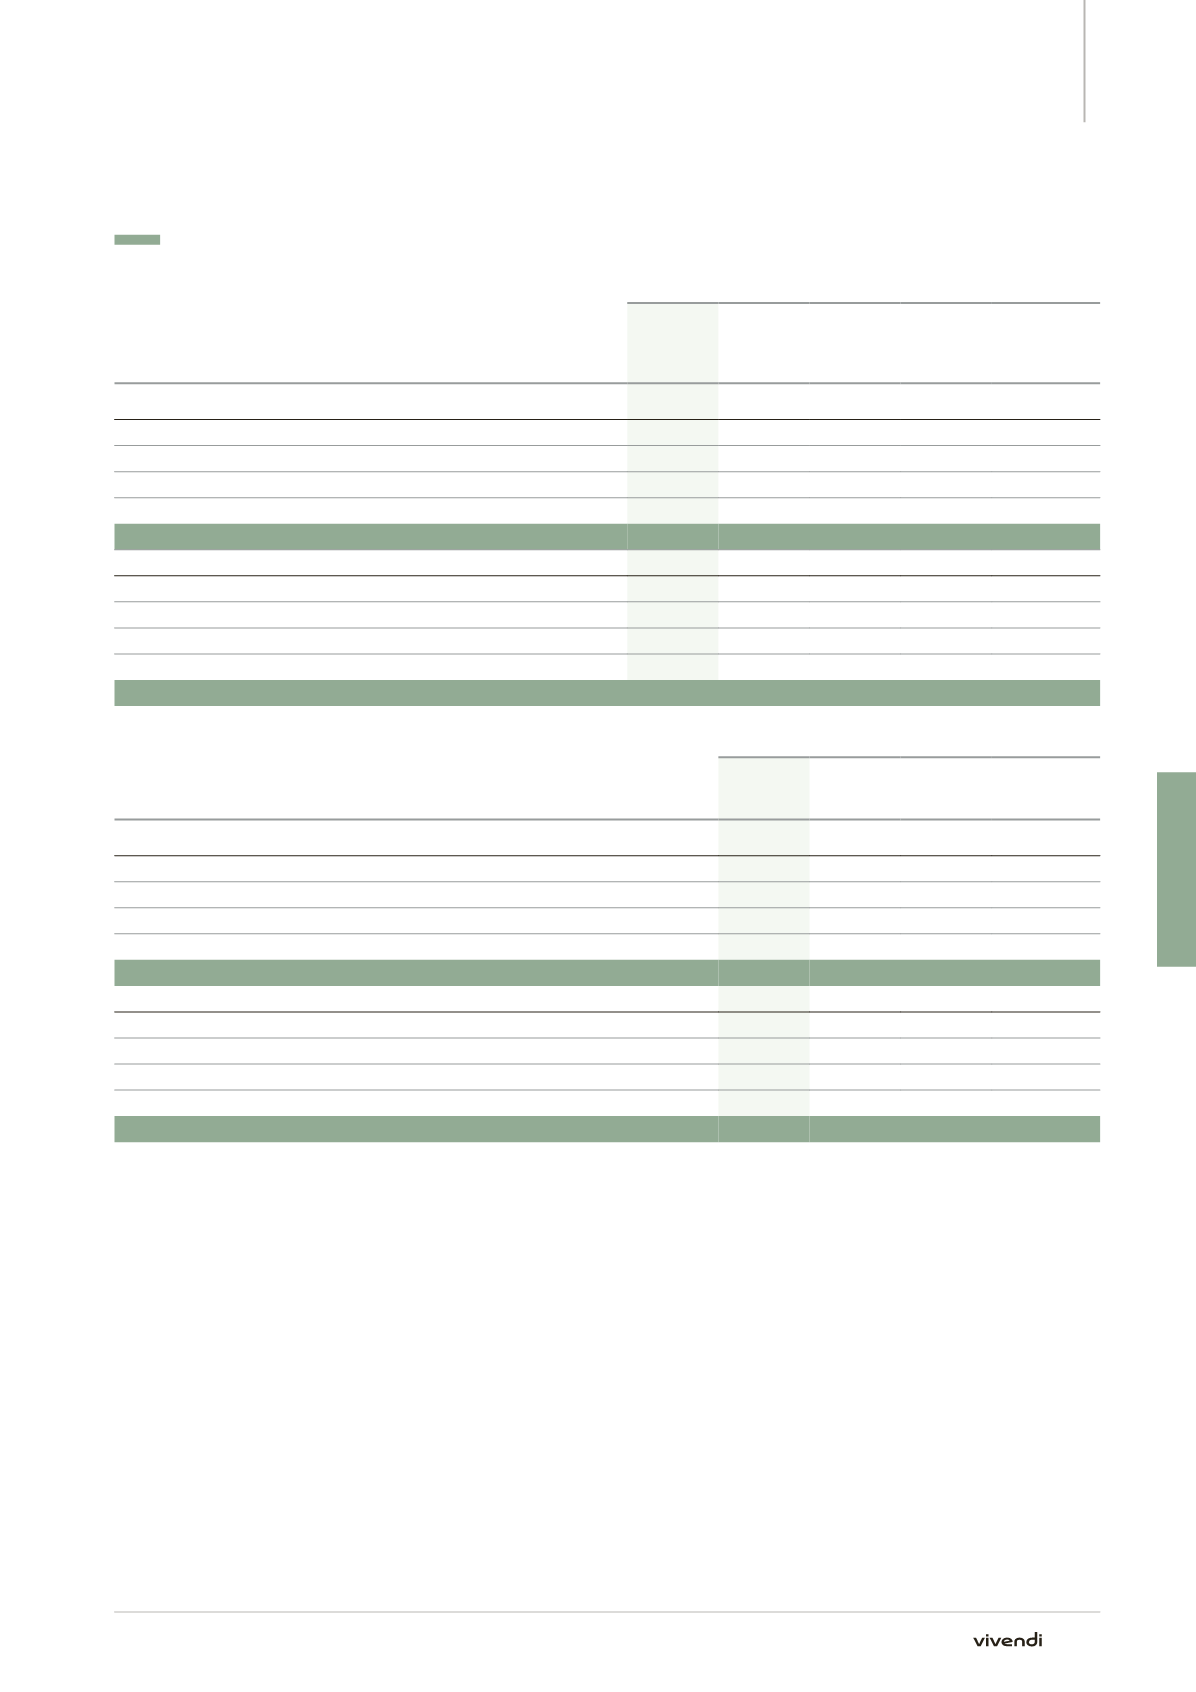
4.1. Revenues, EBITA and cash flow from operations by business segment
(in millions of euros)
Year ended December 31,
2014
2013 % Change
% Change
at constant
rate
% Change
at constant
rate and
perimeter
(a)
Revenues
Canal+ Group
5,456
5,311
+2.7% +2.6%
+0.4%
Universal Music Group
4,557
4,886
-6.7% -5.6%
-3.8%
Vivendi Village
96
71
Elimination of intersegment transactions
(20)
(16)
Total Vivendi
10,089
10,252
-1.6% -1.1%
-1.4%
EBITA
Canal+ Group
583
611
-4.7% -4.8%
-6.3%
Universal Music Group
565
511
+10.7% +11.3% +20.2%
Vivendi Village
(79)
(80)
Corporate
(70)
(87)
Total Vivendi
999
955
+4.6% +4.8%
+8.1%
(in millions of euros)
Year ended December 31,
2014
2013 % Change
% Change
at constant
rate
Cash flow from operations, before capital expenditures, net (CFFO before capex, net)
Canal+ Group
722
689
+4.6%
Universal Music Group
471
611
-22.8%
Vivendi Village
(38)
(72)
Corporate
(69)
(89)
Total Vivendi
1,086
1,139
-4.7%
Cash flow from operations (CFFO)
Canal+ Group
531
478
+11.1% +10.9%
Universal Music Group
425
585
-27.3% -27.8%
Vivendi Village
(44)
(80)
Corporate
(69)
(89)
Total Vivendi
843
894
-5.8%
-6.4%
(a)
Constant perimeter reflects the following changes made in the consolidation scope:
–– at Canal+ Group: it excludes the impacts in 2014 of the acquisitions of Red Production Company (on November 22, 2013), of Mediaserv (on
February 13, 2014) and of Thema (on October 28, 2014); and
–– at UMG: it excludes the impacts in 2013 of operating the Parlophone Label Group repertoire.
173
Annual Report 2014