


 63 / 71

Environmental Indicators
Climate Change
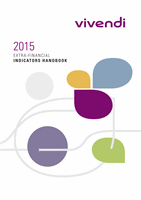
STEAM USED FOR SPACE HEATING
(MWH)
GRI
UNGC
OECD
G4-EN3
-
VI.1.a
2015
2014
UMG
392,041
217,031
*
C+G
3,041
2,907
Of which SECP
235
974
Vivendi Village
na
-
Corporate
939
1,039
Total
396,021
220,977*
*
Data updated from 2014.
UMG sites use an energy mix that combines steam with other energy
sources used for heating. Steam is the sole energy source used for
heating at one of the two UMG sites in New York, making this site the
leading contributor to the group’s steam data for this indicator (99%). It
should be noted that, between 2014 and 2015, the total volume of steam
used by this site rose sharply as a result of the reconfiguration of the
measurement instruments in the steam plants.
6.4. Climate Change
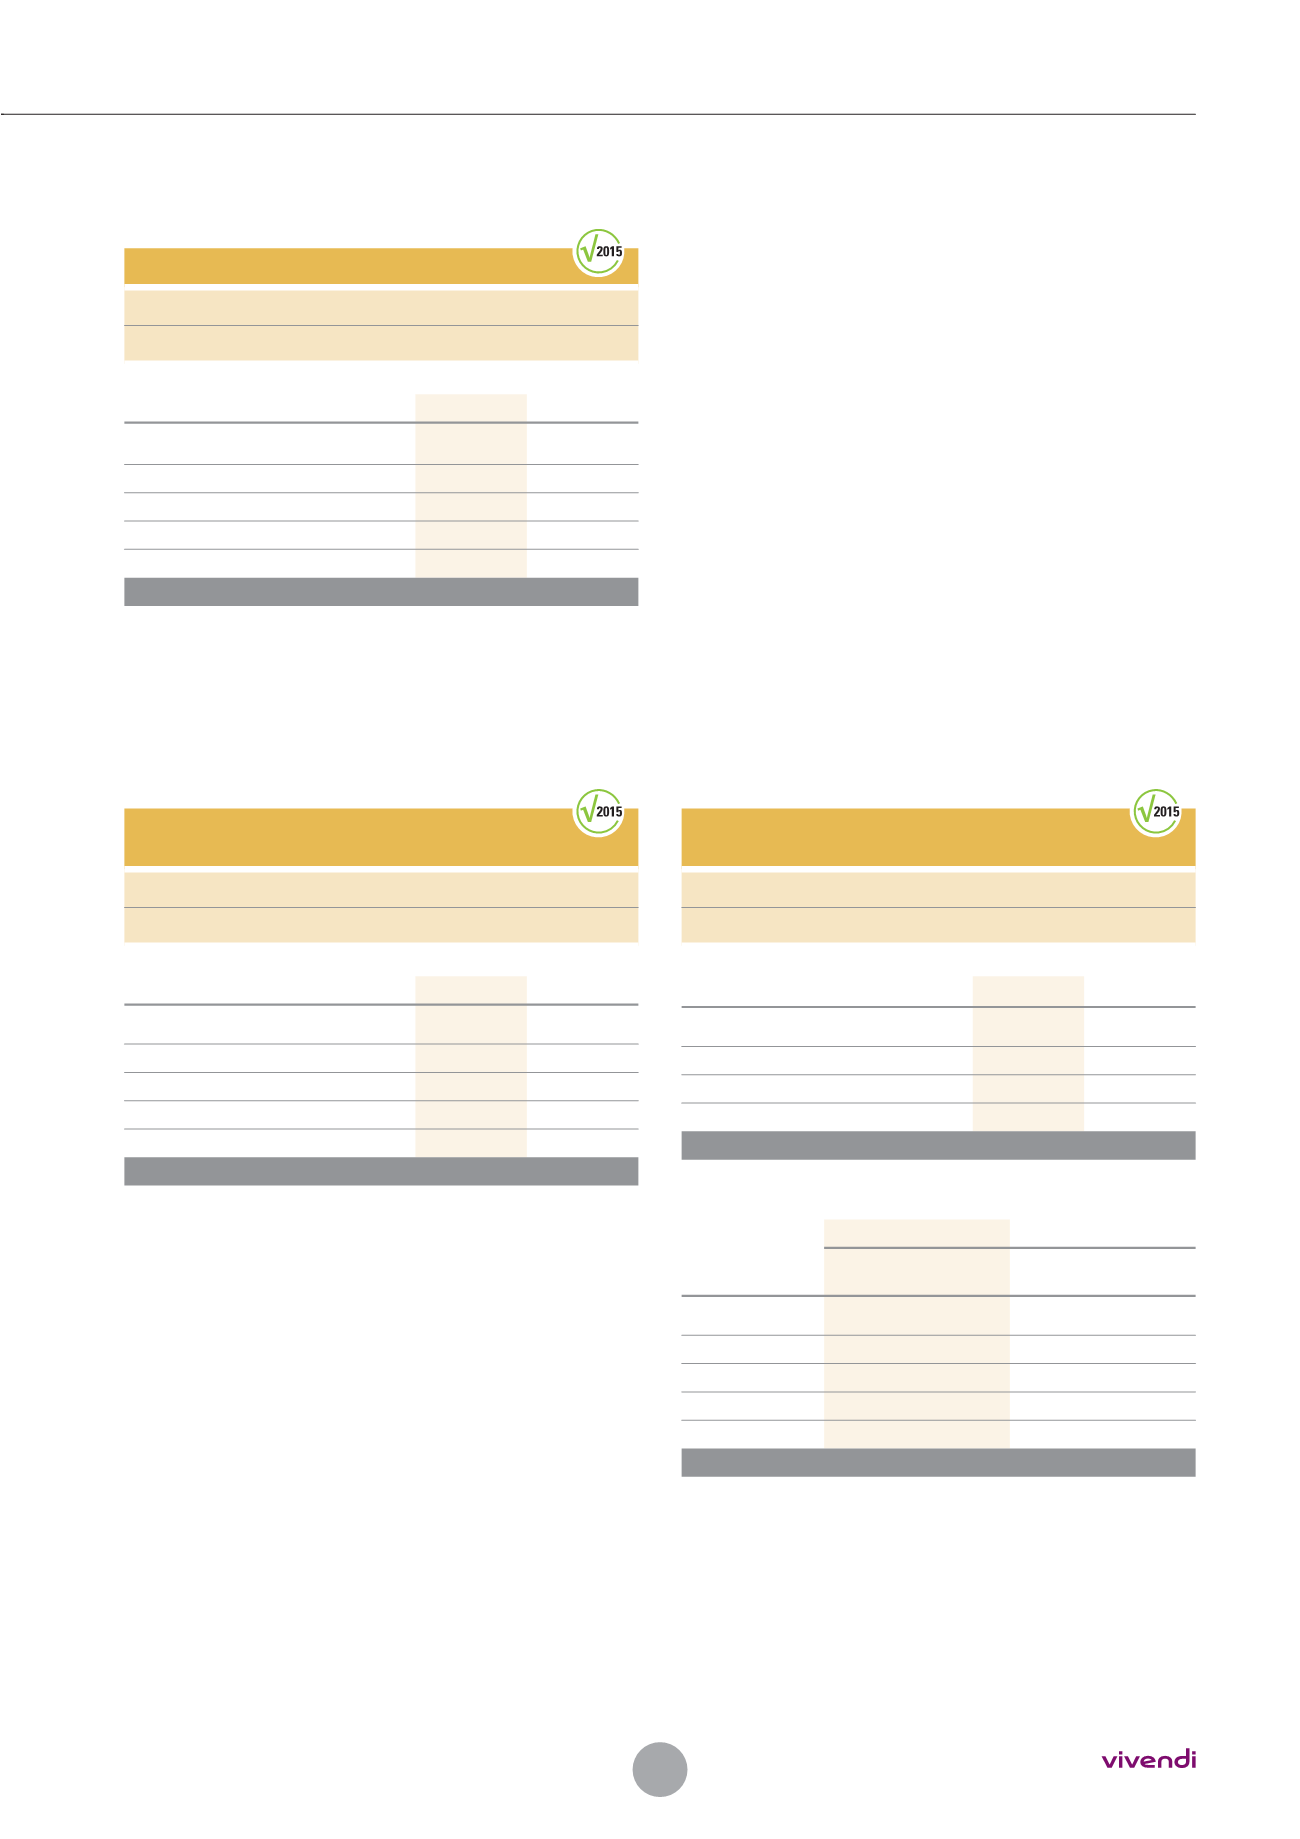
CO2 EMISSIONS DUE TO USAGE
OF MOBILE SOURCES
(TCO
2
EQ)
GRI
UNGC
OECD
G4-EN3, EN15, EN16, EN30
-
VI.1.a
2015
2014
UMG
1,598
1,685
C+G
2,120
1,871
Of which SECP
120
129
Vivendi Village
52
-
Corporate
32
96
Total
3,802
3,652
The amount of CO
2
emissions attributable to vehicles rose slightly due to
greater use of vehicles in 2015.
In France, Canal+ Group is continuing its efforts to progressively replace
its vehicles with less polluting ones, which has enabled it to reduce its
CO
2
emissions by 50g/km per vehicle over the last few years.
UMG’s site in the Netherlands has voluntarily started to build up a fleet of
vehicles powered by liquefied natural gas (LNG), which emit less CO
2
per
liter consumed. UMG in Sweden has invested in electric vehicles, which
are made available to its employees for business travel.
CO
2
EMISSIONS DUE TO USAGE
OF FIXED SOURCES
(TCO
2
EQ)
GRI
UNGC
OECD
G4-EN3, EN15, EN16, EN30
-
VI.1.a
2015
2014
*
Electricity
27,048
33,632
Refrigerants
1,972
2,643
Domestic fuel
121
267
Other sources (steam, gas)
81,948
46,618
Total
111,089
83,160
*
The 2014 figures have been restated following GVT’s departure from the group.
2015
2014
Electricity
Other
sources Electricity
Other
sources
UMG
12,615
81,864
22,069
46,719
C+G
13,826
1,987
11,347
2,598
Of which SECP
332
49
1,906
692
Vivendi Village
401
na
-
-
Corporate
207
191
215
211
Total
27,049
84,042
33,631
49,528
EXTRA-FINANCIAL INDICATORS HANDBOOK
2015
63