


 44 / 71

Social Indicators
Employment
Headcount by Age
HEADCOUNT BY AGE
(%)
GRI
UNGC
OECD
G4-10, G4-LA12
1, 6
V
2015
2014
Under 25
25-34
35-44
45-54
55
and over Under 25
25-34
35-44
45-54
55
and over
UMG
6% 32% 30% 24% 8%
6% 31% 32% 23% 8%
C+G
8% 40% 33% 15% 4%
8% 40% 34% 15% 3%
of which SECP
7% 19% 32% 32% 10%
7% 19% 36% 30% 8%
Vivendi Village
12% 50% 27% 8% 3%
13% 56% 24% 6% 1%
Dailymotion
9% 65% 24% 2% 0%
-
-
-
-
-
Corporate
2% 15% 24% 35% 24%
2% 15% 27% 33% 23%
Total
7% 37% 31% 19% 6% 7% 36% 32% 19% 6%
AVERAGE AGE
(IN YEARS)
GRI
UNGC
OECD
G4-10, G4-LA12
1, 6
IV, V.I.e
2015
2014
UMG
39.6
39.3
C+G
36.3
36.1
Vivendi Village
33.4
32.6
Dailymotion
31.5
-
Corporate
46.2
46.4
Total
37.8
37.6
AVERAGE SENIORITY
(IN YEARS)
GRI
UNGC
OECD
G4-LA1
6
V
2015
2014
UMG
8.8
8.6
C+G
7.4
7.6
Vivendi Village
3.9
3.4
Dailymotion
2.4
-
Corporate
14.6
15.2
Total
7.9
8.0
Average seniority in the Vivendi Group is stable.
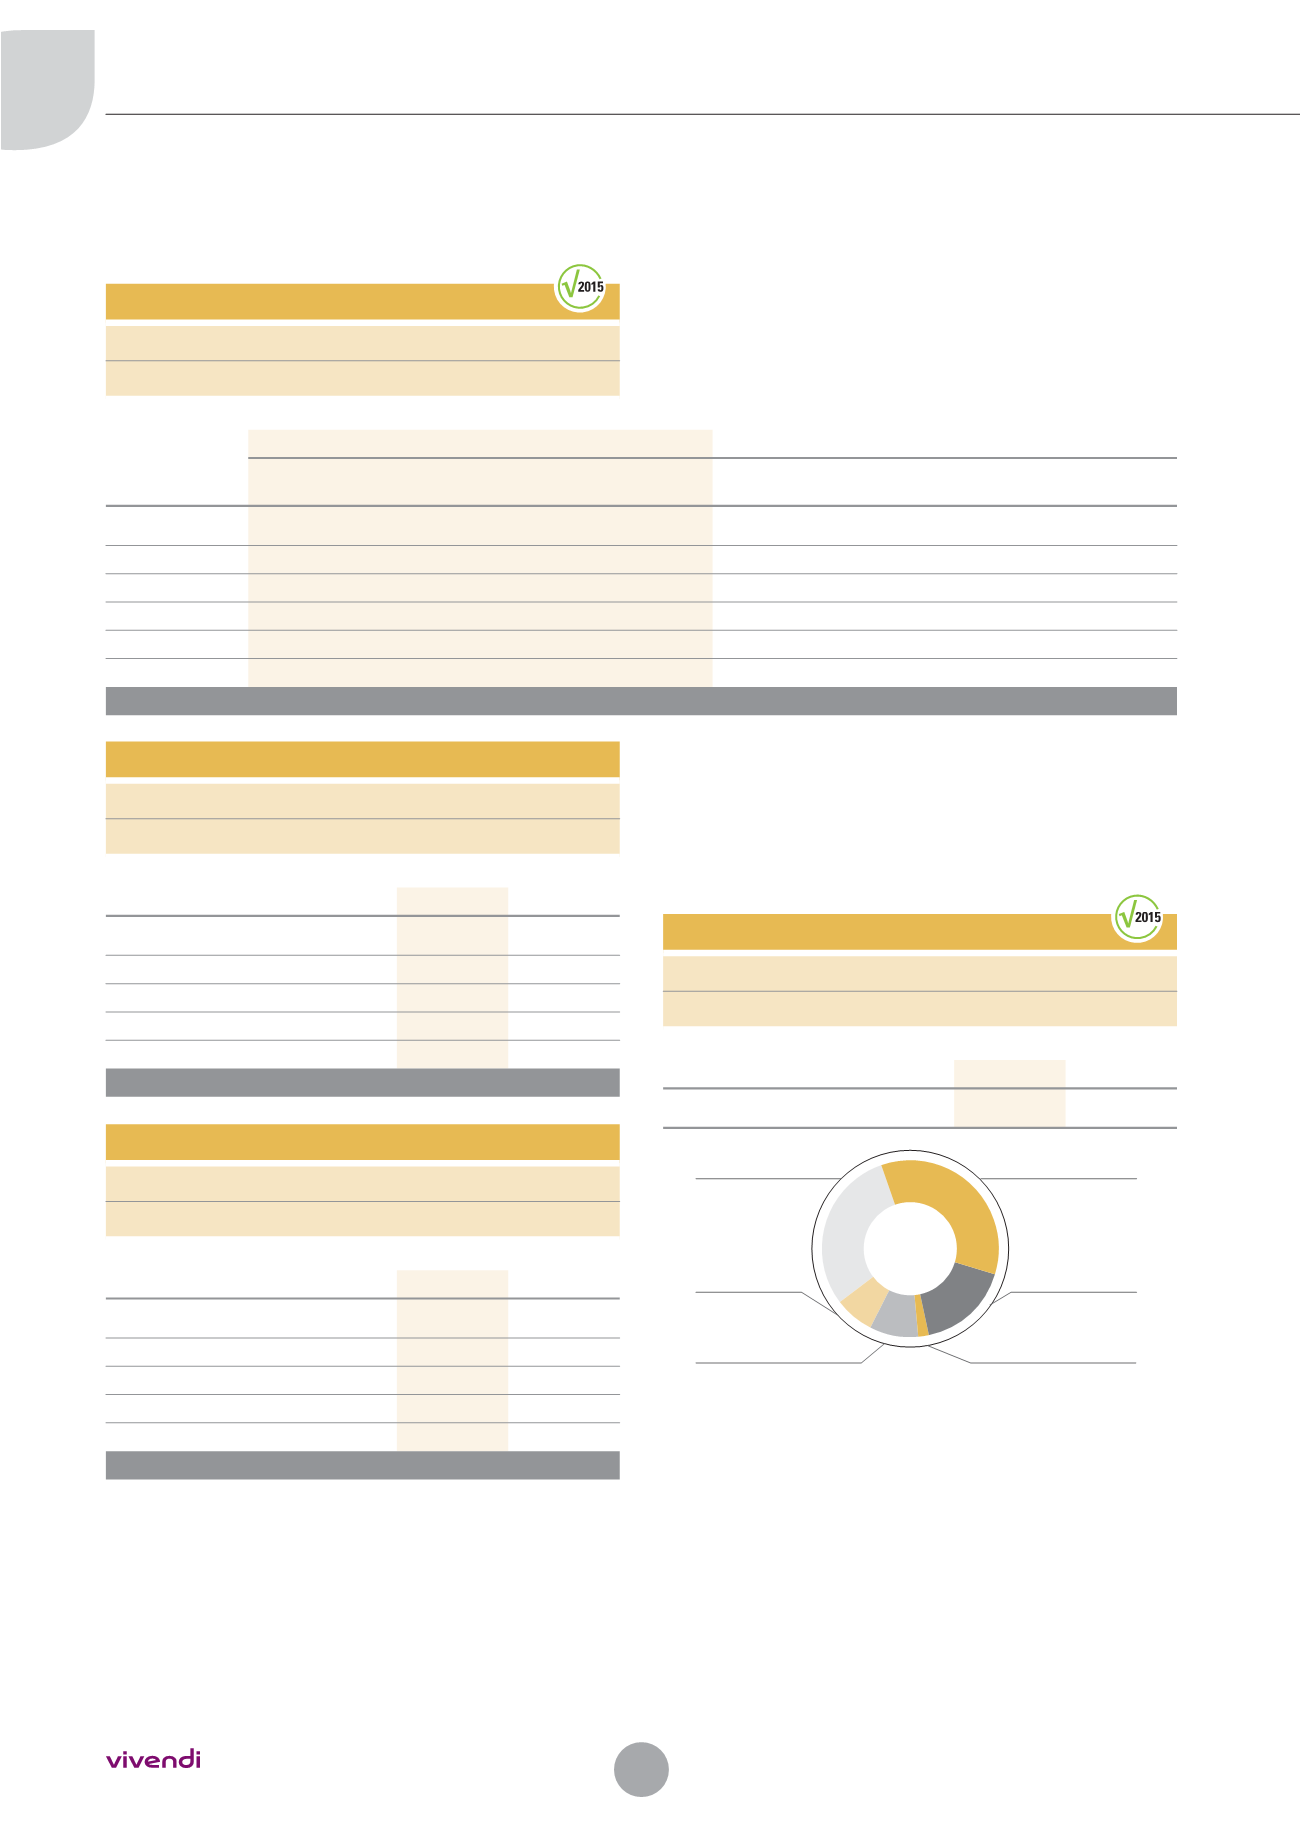
Headcount by Geographic Region
The table below shows the group’s headcount by geographic region as
of December 31, 2015. The heading “France” includes the headcount
of companies in mainland France and its overseas departments and
territories.
HEADCOUNT BY GEOGRAPHIC REGION
GRI
UNGC
OECD
G4-10
-
V
2015
2014
Consolidated data
16,395
15,571
France
5,694 (35%)
Europe (excl. France)
5,016 (30%)
North America
2,783 (17%)
Africa
1,143 (7%)
South and Central America
339 (2%)
Asia-Pacific
1,420 (9%)
2015
16,395
EXTRA-FINANCIAL INDICATORS HANDBOOK
2015
44