Simplified organization chart and key figures

Vivendi
Share Price --,--
  • Home
  • Our Group
    • Our Group
    • At a glance
    • Together
    • Governance
      • Governance
      • Supervisory Board
      • Censor
      • Management Board
      • Compliance program
      • By-laws
      • Communication
        • Communication
        • Telecom Italia’s 2015 and 2017 shareholders’ meetings
        • Restoring value for Telecom Italia
    • Our social, societal and environmental commitments
      • Our social, societal and environmental commitments
      • Our social commitments
      • Our societal commitments
      • Our environmental commitments
    • Vivendi Create Joy
      • Vivendi Create Joy
      • Vivendi Create Joy’s partnerships
      • Contact
    • Key milestones
      • Key milestones
      • The Group’s origins
  • Our activities
    • Our activities
    • Discover our activities and brands
    • Music
    • Audiovisual & cinema
    • Communications
    • Publishing
    • Gaming
    • Live performance
    • Distribution platforms
  • Shareholders & investors
    • Shareholders & investors
    • Shareholders & investors in a nutshell
    • Vivendi share
    • Simplified organization chart and key figures
    • Shareholders’ meeting
      • Shareholders’ meeting
      • Previous AGMs
    • Individual shareholders
      • Individual shareholders
      • Shareholders newsletters
      • Shareholders’ club
        • Shareholders’ club
        • Join the Vivendi’s Shareholders Club
      • Shareholders’ committee
        • Shareholders’ committee
        • Members
        • Committee meeting minutes
        • Committee charter
      • Shareholders’ booklet
        • Shareholders’ booklet
        • Shareholders’ information
        • Vivendi and the stock market
        • Registered shareholders
        • Dividend
        • Shareholders’ meeting
        • Glossary
    • Financial publications and reports
      • Financial publications and reports
      • Financial results
      • Investor presentation
      • Archives
        • Archives
        • Results of subsidiaries
        • SFR / SIG 50 & their subsidiaries – Combined financial statements
    • Regulatory information
      • Regulatory information
      • Financial reports
      • Annual reports
      • Voting rights and shares
      • Treasury share transactions
      • Liquidity agreement
      • Temporary acquisitions/disposals of Vivendi shares
      • Operations
      • Operations /
        Transactions /
        Privileged information
      • Notices of meeting of noteholders
    • Financial agenda
    • Financial operations
    • Bond debt
      • Bond debt
      • Press releases, presentations, notices
      • Credit ratings
      • Main bonds outstanding
      • Notices of meeting of noteholders
    • Contacts
  • Press
    • Press
    • Press in a nutshell
    • Press releases
    • News
    • Picture library
    • Contacts
  • Careers
    • Careers
  • Search
      • Quick Links
        • Press releases
        • News
        • Financial reports
        • Individual shareholders
        • Shareholders’ meeting
        • CSR
    • fr
    • en

    Home > Shareholders & investors > Simplified organization chart…

    Simplified economic organization chart of the Group

    Click here for a larger view of the image

    2019 key figures

    • €15,898m

      Revenues (+14.1% compared to 2018)

    • €1,526m

      EBITA (+18.5% compared to 2018)

    • €1,741m

      Adjusted net income (+50.5% compared to 2018)

      • 44,000

        employees in 81 countries

      • €3.4bn

        Investments in content

        • 51%

          of Group employees are women

        • 17%

          of the electricity used by the Group was generated using renewable energy sources

          Selected key consolidated financial data

          Preliminary comments

          As from January 1, 2019, Vivendi applies the new accounting standard IFRS 16 – Leases. In accordance with IFRS 16, the impact of the change of accounting standard was recorded in the opening balance sheet as of January 1, 2019. Moreover, Vivendi applied this change of accounting standard to the Statement of Financial Position, Statement of Earnings and Statement of Cash Flows in 2019; therefore, the data relative to prior years is not comparable. For a detailed description, please refer to Notes 1.1, 1.3.5.7 and 11 to the Consolidated Financial Statements for the year ended December 31, 2019.

          As a reminder, in 2018, Vivendi applied two new accounting standards:

          • IFRS 15 – Revenues from Contracts with Customers: in accordance with IFRS 15, as from 2017, Vivendi applied this change of accounting standard to revenues. The data presented below with respect to fiscal years 2015 to 2016 are historical and therefore unrestated; and
          • IFRS 9 – Financial Instruments: in accordance with IFRS 9, as from 2018, Vivendi applied this change of accounting standard to the Statement of Earnings and Statement of Comprehensive Income restating its opening balance sheet as of January 1, 2018; therefore, the data relative to prior years in this report is not comparable.

          In addition, Vivendi deconsolidated GVT as from May 28, 2015, the date of its effective sale by Vivendi. In compliance with IFRS 5, this business was reported as a discontinued operation for 2015 as set out in the table of selected key consolidated financial data below in respect of data reflected in the Statement of Earnings and Statement of Cash Flows.


          Year ended December 31,
          2019 2018 2017 2016 2015
          Consolidated data
          Revenues 15,898 13,932 12,518 10,819 10,762
          Income from operations (a) 1,719 1,439 1,098 853 1,061
          Adjusted earnings before interest and income taxes (EBITA) (a) 1,526 1,288

          969

          724 942
          Earnings before interest and income taxes (EBIT) 1,381 1,182

          1,018

          887 521
          Earnings attributable to Vivendi shareowners 1,583 127

          1,216

          1,256 1,932
          of which earnings from continuing operations attributable to Vivendi shareowners 1,583 127 1,216 1,236 699
          Adjusted net income (a) 1,741 1,157

          1,300

          755 697
          Net Cash Position/(Financial Net Debt) (a) (4,064) 176

          (2,340)

          1,231 7,172
          Total equity 15,575 17,534

          17,866

          19,612 21,086
          of which Vivendi shareowners’ equity 15,353 17,313

          17,644

          19,383 20,854
          Cash flow from operations (CFFO) (a) 903 1,126

          989

          729 892

          Cash flow from operations after interest and income tax paid (CFAIT) (a)

          567 822 1,346 341 (69)
          Financial investments (2,284) (694)

          (3,685)

          (4,084) (3,927)
          Financial divestments 1,068 2,303

          976

          1,971 9,013
          Dividends paid by Vivendi to its shareholders 636 568

          499

          (b) 2,588  2,727
          Purchases/(sales) of Vivendi’s treasury shares 2,673 –

          203

          1,623 492
          Per share data
          Weighted average number of shares outstanding 1,233.5 1,263.5

          1,252.7

          1,272.6 1,361.5
          Earnings attributable to Vivendi shareowners per share – basic 1.28 0.10

          0.97

          0.99 1.42
          Adjusted net income per share 1.41 0.92

          1.04

          0.59 0.51
          Number of shares outstanding at the end of the period (excluding treasury shares) 1,170.6 1,268.0

          1,256.7

          1,259.5 1,342.3
          Equity per share, attributable to Vivendi shareowners 13.12 13.65

          14.04

          15.39 15.54
          Dividends per share paid 0.50 0.45

          0.40

          (b) 2.00  2.00

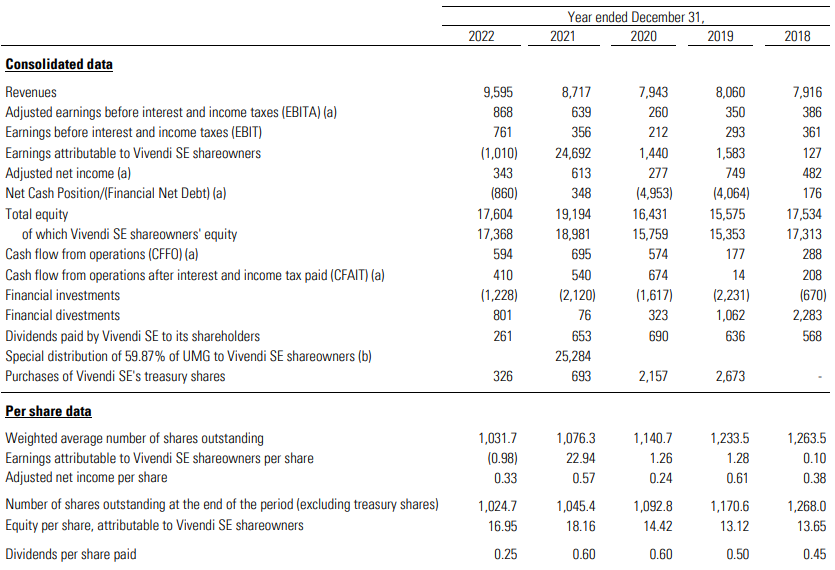
          In millions of euros, number of shares in millions, data per share in euros.na: not applicable.

          (a) The non-GAAP measures of Income from operations, EBITA, Adjusted net income, Net Cash Position (or Financial Net Debt), Cash flow from operations (CFFO) and Cash flow from operations after interest and income tax paid (CFAIT) should be considered in addition to, and not as a substitute for, other GAAP measures of operating and financial performance as presented in the Consolidated Financial Statements and the related Notes, or as described in this Financial Report. Vivendi considers these to be relevant indicators of the group’s operating and financial performance. Each of these indicators is defined in the appropriate section of this Financial Report. In addition, it should be noted that other companies may have definitions and calculations for these indicators that differ from those used by Vivendi, thereby affecting comparability.

          (b) With respect to fiscal year 2015, Vivendi paid an ordinary dividend of €3 per share, i.e., an aggregate dividend payment of €3,951 million. This amount included €1,363 million paid in 2015 (first interim dividend of €1 per share) and €2,588 million paid in 2016 (€1,318 million for the second interim dividend of €1 per share and €1,270 million representing the balance of €1 per share). In addition, in 2015, Vivendi paid a dividend with respect to fiscal year 2014 of €1 per share, i.e., €1,364 million.

          • At a glance

            Keep reading
            At a glance...
          • Discover our activities and brands

            Keep reading
            Discover our activities and brands...
            Vivendi
            • Our Group
              • At a glance
              • Governance
              • Our social, societal and environmental commitments
              • Vivendi Create Joy
              • Tax policy
              • Vivendi Deferred 2008 Members' Scheme
            • Shareholders & investors
              • Shareholders & investors in a nutshell
              • Shareholders' meeting
              • Individual shareholders
              • Regulatory information
            • Press
              • Press releases
              • News
              • Picture library
            • Information
              • Forward Looking Statements and other Disclaimers
            • Stay in the loop
              • Dailymotion
              • Twitter
              • Linkedin
            • Language
              English
              • Français
            • Terms of use
            • Legal notices
            • Personal data
            • Cookies policy
            • Credits
            • Contrast
            Close